SQS Pro Signals Indicator
Trade SPY, QQQ & SPX Options & Stocks

Key Features
Real-Time Alerts: Stay ahead with instant notifications when it's time to place a trade.
Backtesting Function: Analyse hypothetical scenarios to prepare for any market condition.
Dual Indicator Setup: Use two copies of the indicator to track both AM and PM trades
SQS Pro Signals handles all the chart monitoring and sends you timely alerts ahead of a trade being called out, do something else while waiting for the market to make its move
How do SQS Pro Signals help you?
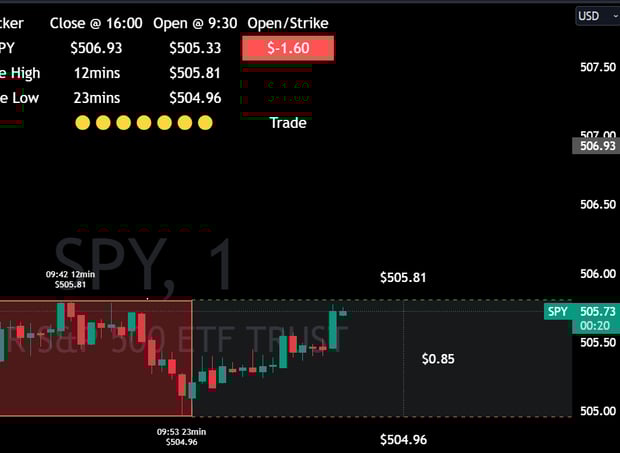
Stage 1 - Prior to / At Market Open
Pre Trade Movement
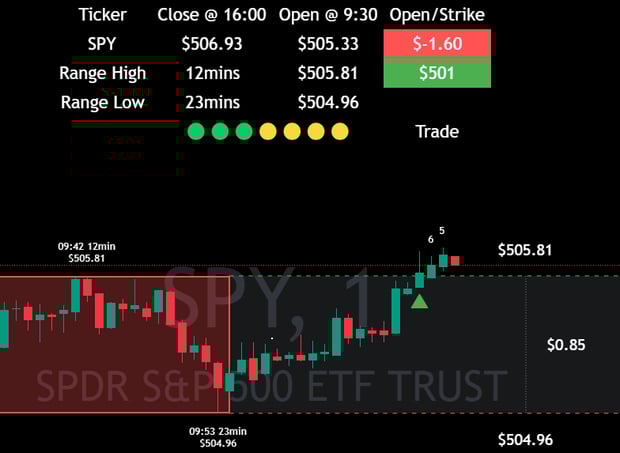
At market open the indicator starts to work and records the previous day close price and the opening price on the Summary Table. The difference is also shown and plotted on the chart
As the candles open and close the dynamic Opening Range Box expands to show the price movement
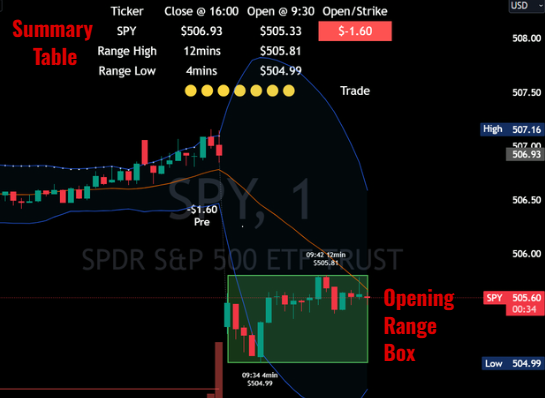
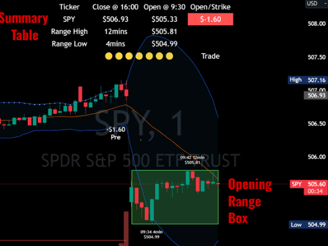
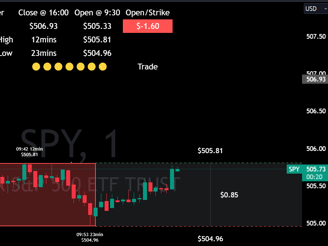
Stage 2 - After Market Open
Opening Range Box
After the Opening Range period ends the candles are monitored to identify a breakout which starts if either the High or Low lines are crossed by a number of defined candles. The example here shows no breakout as the candles are within these values so the Trade stages are still yellow
As each of the candles open and close the dynamic Opening Range Box expands to show the price movement and the highs and lows also plotting the values on the chart
Stage 3 - Monitoring Candles for a Breakout
Identify Candle Breakout
At market open the indicator starts to work and records the previous day close price and the opening price on the Summary Table. The difference is also shown and plotted on the chart
As the candles open and close the dynamic Opening Range Box expands to show the price movement
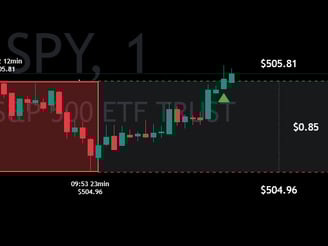
Stage 4 - Monitors Candles
Trade Countdown
At market open the indicator starts to work and records the previous day close price and the opening price on the Summary Table. The difference is also shown and plotted on the chart
As the candles open and close the dynamic Opening Range Box expands to show the price movement
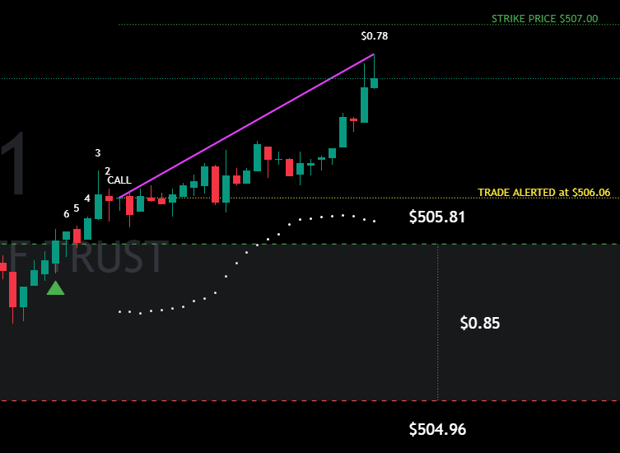
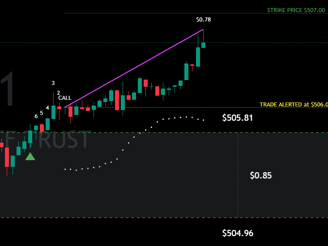
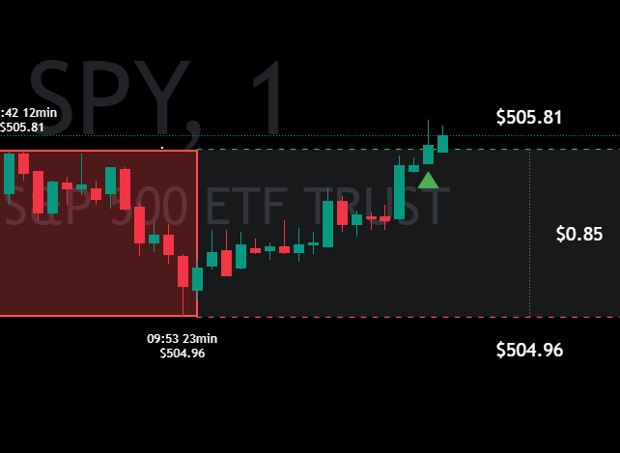
Stage 5 - The Trade
Trade Confirmed
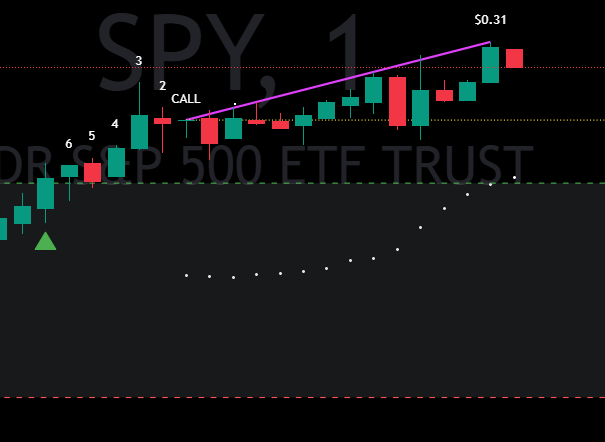
This shows when the breakout to the upside is confirmed and 'CALL' is plotted above the candle, you can now place your trade
As the candles move upwards a pivot line is drawn to show the highest gain and a dotted line is plotted which is the lower Bollinger Band for you to consider closing your trade if 3 candles close lower. Alerts will let you know when this happens
Stage 6 - When in a Trade
Manage Your Trade
This part is up to you as only you know what your trading plan is!! Do you have one?
Align the settings to your own strategy, set Take Profit levels to scale out of your trades
You must have your own strategy and make regular improvements, but stick to your plan
DON'T OVERTRADE - Keep all of your trades the same size
DO NOT risk more than 5 - 10% of your cash portfolio on any single trade (5% to start)
Regular and consistent profits are what you should aim for... write down your plan and follow it. Make adjustments where needed
DON'T STRAY FROM YOUR PLAN